This is Dr. Lowe.

PhD. Five years in biopharma. He works on the next generation of cell therapies. In other words, he helps cure cancer.

And he spends way too much time counting cells, one by one. How many are alive. How many are dead.
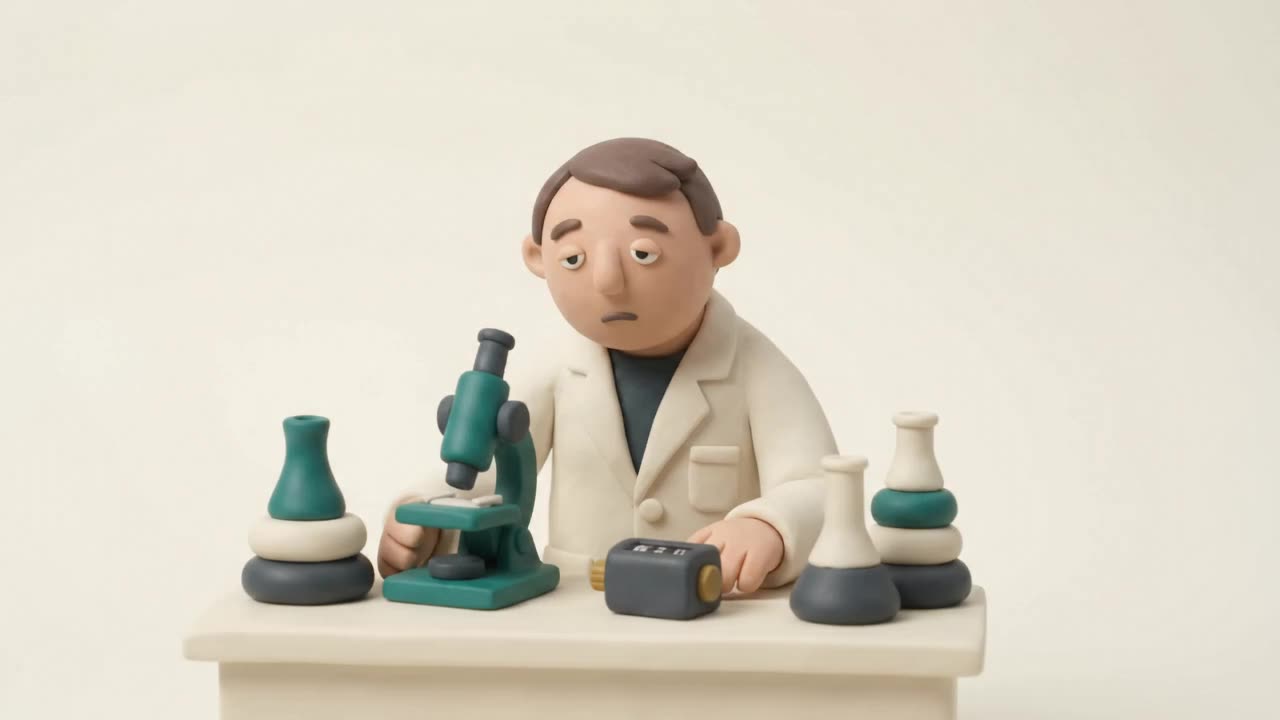

Stop-motion loop of Dr. Lowe counting cells at a microscope with a tally clicker
Two clay scientists at one bench, one counting at the microscope with a clicker while the other peers over their shoulder

And no two counts agree

The field calls it inter-observer and intra-observer variability. It has names because it is everywhere. The bead figures below come from andrology proficiency schemes, which ship identical bead samples to many labs, so the spread is the counting and not the sample.
~5%spread when one lab re-counts the same beads1
14.6%spread between labs counting beads of a known concentration2
20%roughly, between two blinded experts counting the same cell cultures3

The 20% is cells: two blinded experts counting the same A549 cultures, monolayers and spheroids, with trypan blue.

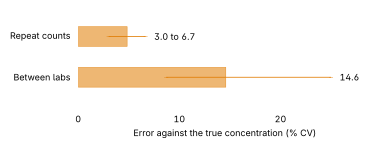
Bar chart of published manual counting error on latex beads of known concentration: repeat counts 3.0 to 6.7 percent, between laboratories 14.6 percent with a range of 8.7 to 25
The first two figures are manual hemocytometer counts of latex beads at a known concentration, from two published studies. Beads, not cells: no clumps, no stain, nothing to argue about, and the counts still spread this much.
  1. 1.Costa AF, Onofre FBM, Onofre ASC. Agreement and internal quality assurance of the Neubauer hemocytometer and Makler chamber for human sperm concentration determination. JBRA Assist Reprod. 2024;28(2):215–223. doi.org/10.5935/1518-0557.20240023
  2. 2.Zuvela E, Matson P. Performance of four chambers to measure sperm concentration: results from an external quality assurance programme. Reprod Biomed Online. 2020;41(4):671–678. doi.org/10.1016/j.rbmo.2020.07.008
  3. 3.Piccinini F, Tesei A, Arienti C, Bevilacqua A. Cell Counting and Viability Assessment of 2D and 3D Cell Cultures: Expected Reliability of the Trypan Blue Assay. Biol Proced Online. 2017;19:8. doi.org/10.1186/s12575-017-0056-3

Measured against the instrument labs already trust

We took sixteen images straight from a leading automated cell counter and let CellCount count the same pixels. CellCount had never seen an image from that instrument. Then we compared, frame by frame and cell by cell.
0.91concordance on cell concentration across the sixteen images
95%same live or dead call on the 6,765 cells both readers found
0images from that instrument in our training data
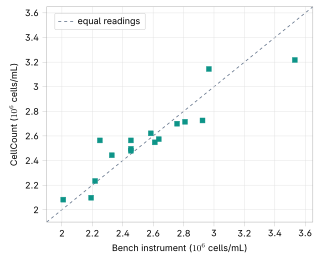
Scatter plot of CellCount concentration against the instrument's for sixteen images, the dots lying along the line of equal readings
Cell concentration, CellCount against the instrument, one dot per image. Concordance is Lin's coefficient: precision times accuracy, so two readers that track each other but sit apart do not score.
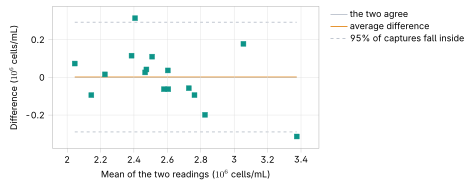
Bland-Altman plot of the difference between CellCount and the instrument against their mean for sixteen images; the average difference sits on the zero line and 95 percent of images fall within about 0.29 million cells per millilitre
The same sixteen images are shown in a Bland–Altman plot. The two readings show almost no average bias, with a mean difference of 0.002 million cells/mL at an average reading of about 2.6 million cells/mL. Most differences fall within approximately ±0.29 million cells/mL, the 95% limits of agreement.
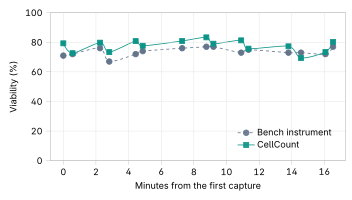
Viability in percent against minutes from the first capture for both readers on a 0 to 100 axis: the two series run a few points apart and move together
Viability across the same session, both readers, on fifteen of the sixteen images (one was set aside as a capture anomaly). CellCount reads about four points higher throughout, and the two move together.

One cell preparation, four chamber loads, one morning. The method, the data and every number on this page are kept with the study and are available on request.

Tested on frames it never saw

Scored against expert human annotation. Detailed analysis on request.

98.7%Accuracy on 2,682 held-out cells
<30 sper 12-megapixel image

Built on the hardware the lab already owns

Nothing to stock, nothing to reorder. One counting protocol, shared by the whole lab, so everyone counts the same way.
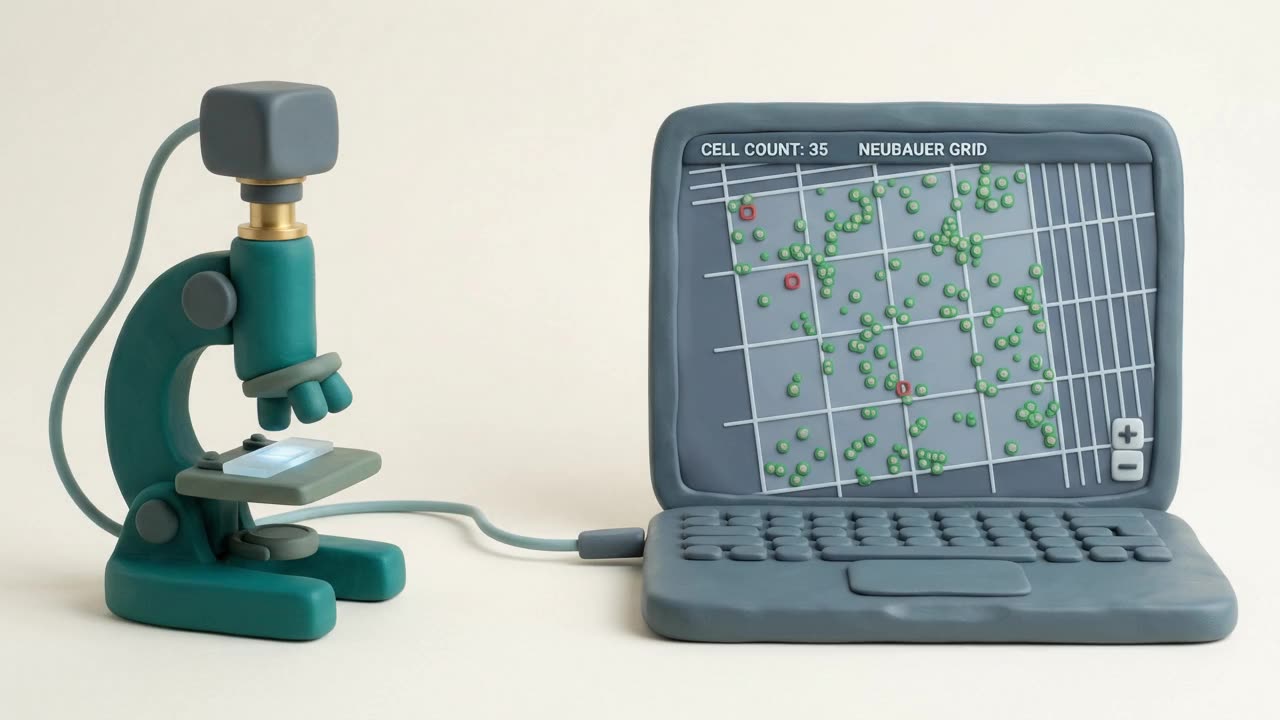
Stop-motion loop of a microscope wired to a laptop whose screen shows the grid with every cell marked and a live count

A camera on the scope

A plug-and-play camera on the microscope port, counting straight into CellCount on the laptop at the bench.
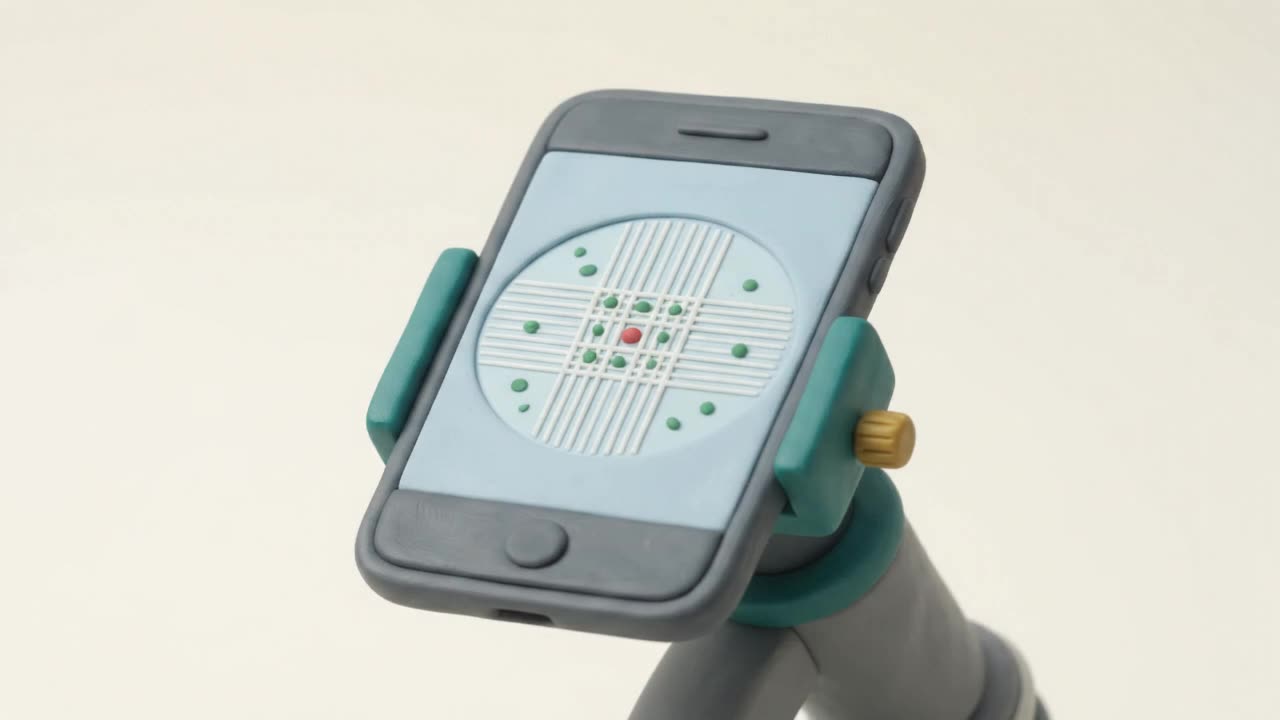
Stop-motion loop of a phone clamped over a microscope eyepiece, its screen showing the ruled grid and cells

A phone at the eyepiece

Hold a phone to the eyepiece and count from the photo. No hardware at all.
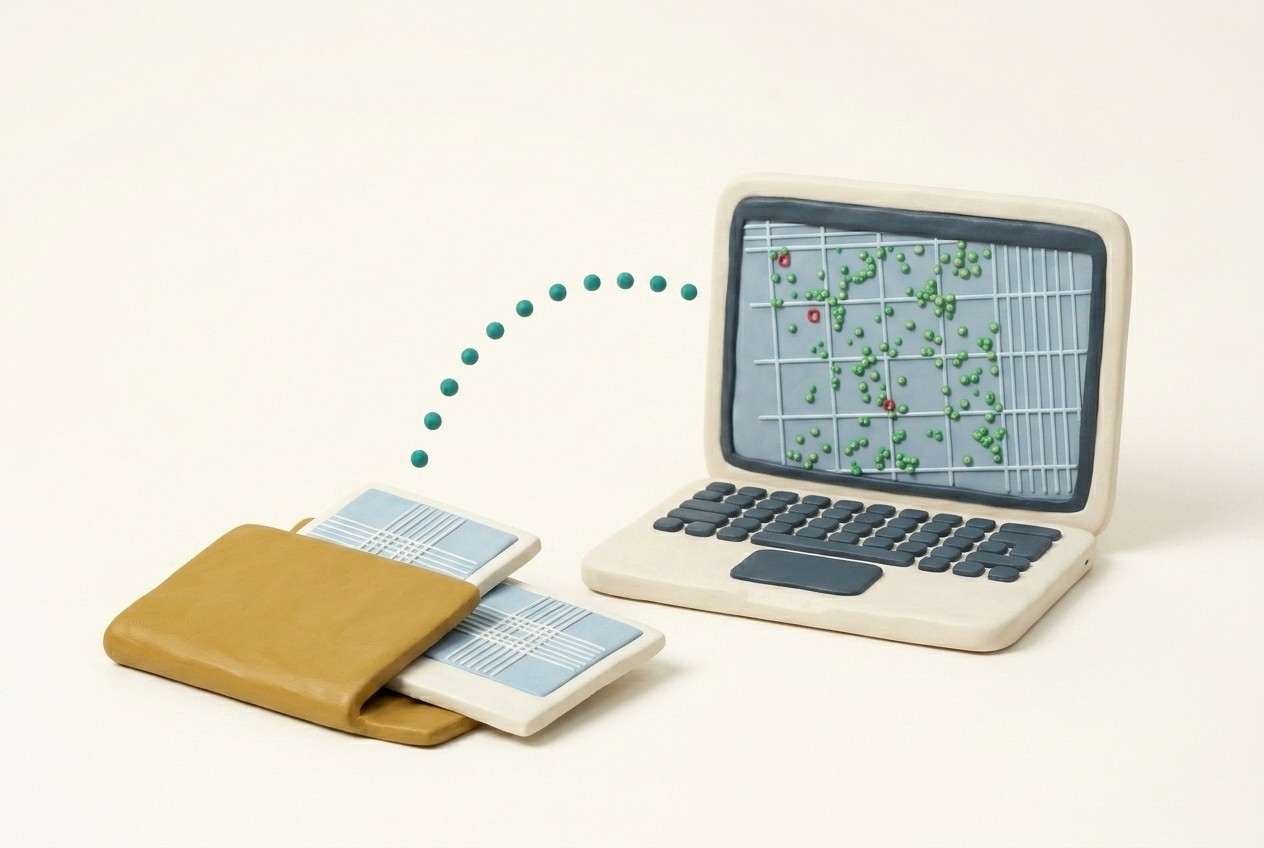
A folder of micrograph slides beside a laptop, images hopping across into the analysis screen

Images you already have

Drop in files from any microscope, or a whole folder at once, so you can see for yourself whether CellCount works on your samples.

We never ask you to trust AI blindly

Every call the model makes can be overruled: add a missed cell, delete a wrong one, flip live to dead, re-run at another sensitivity. Nothing is final until the person who knows the sample signs it off.
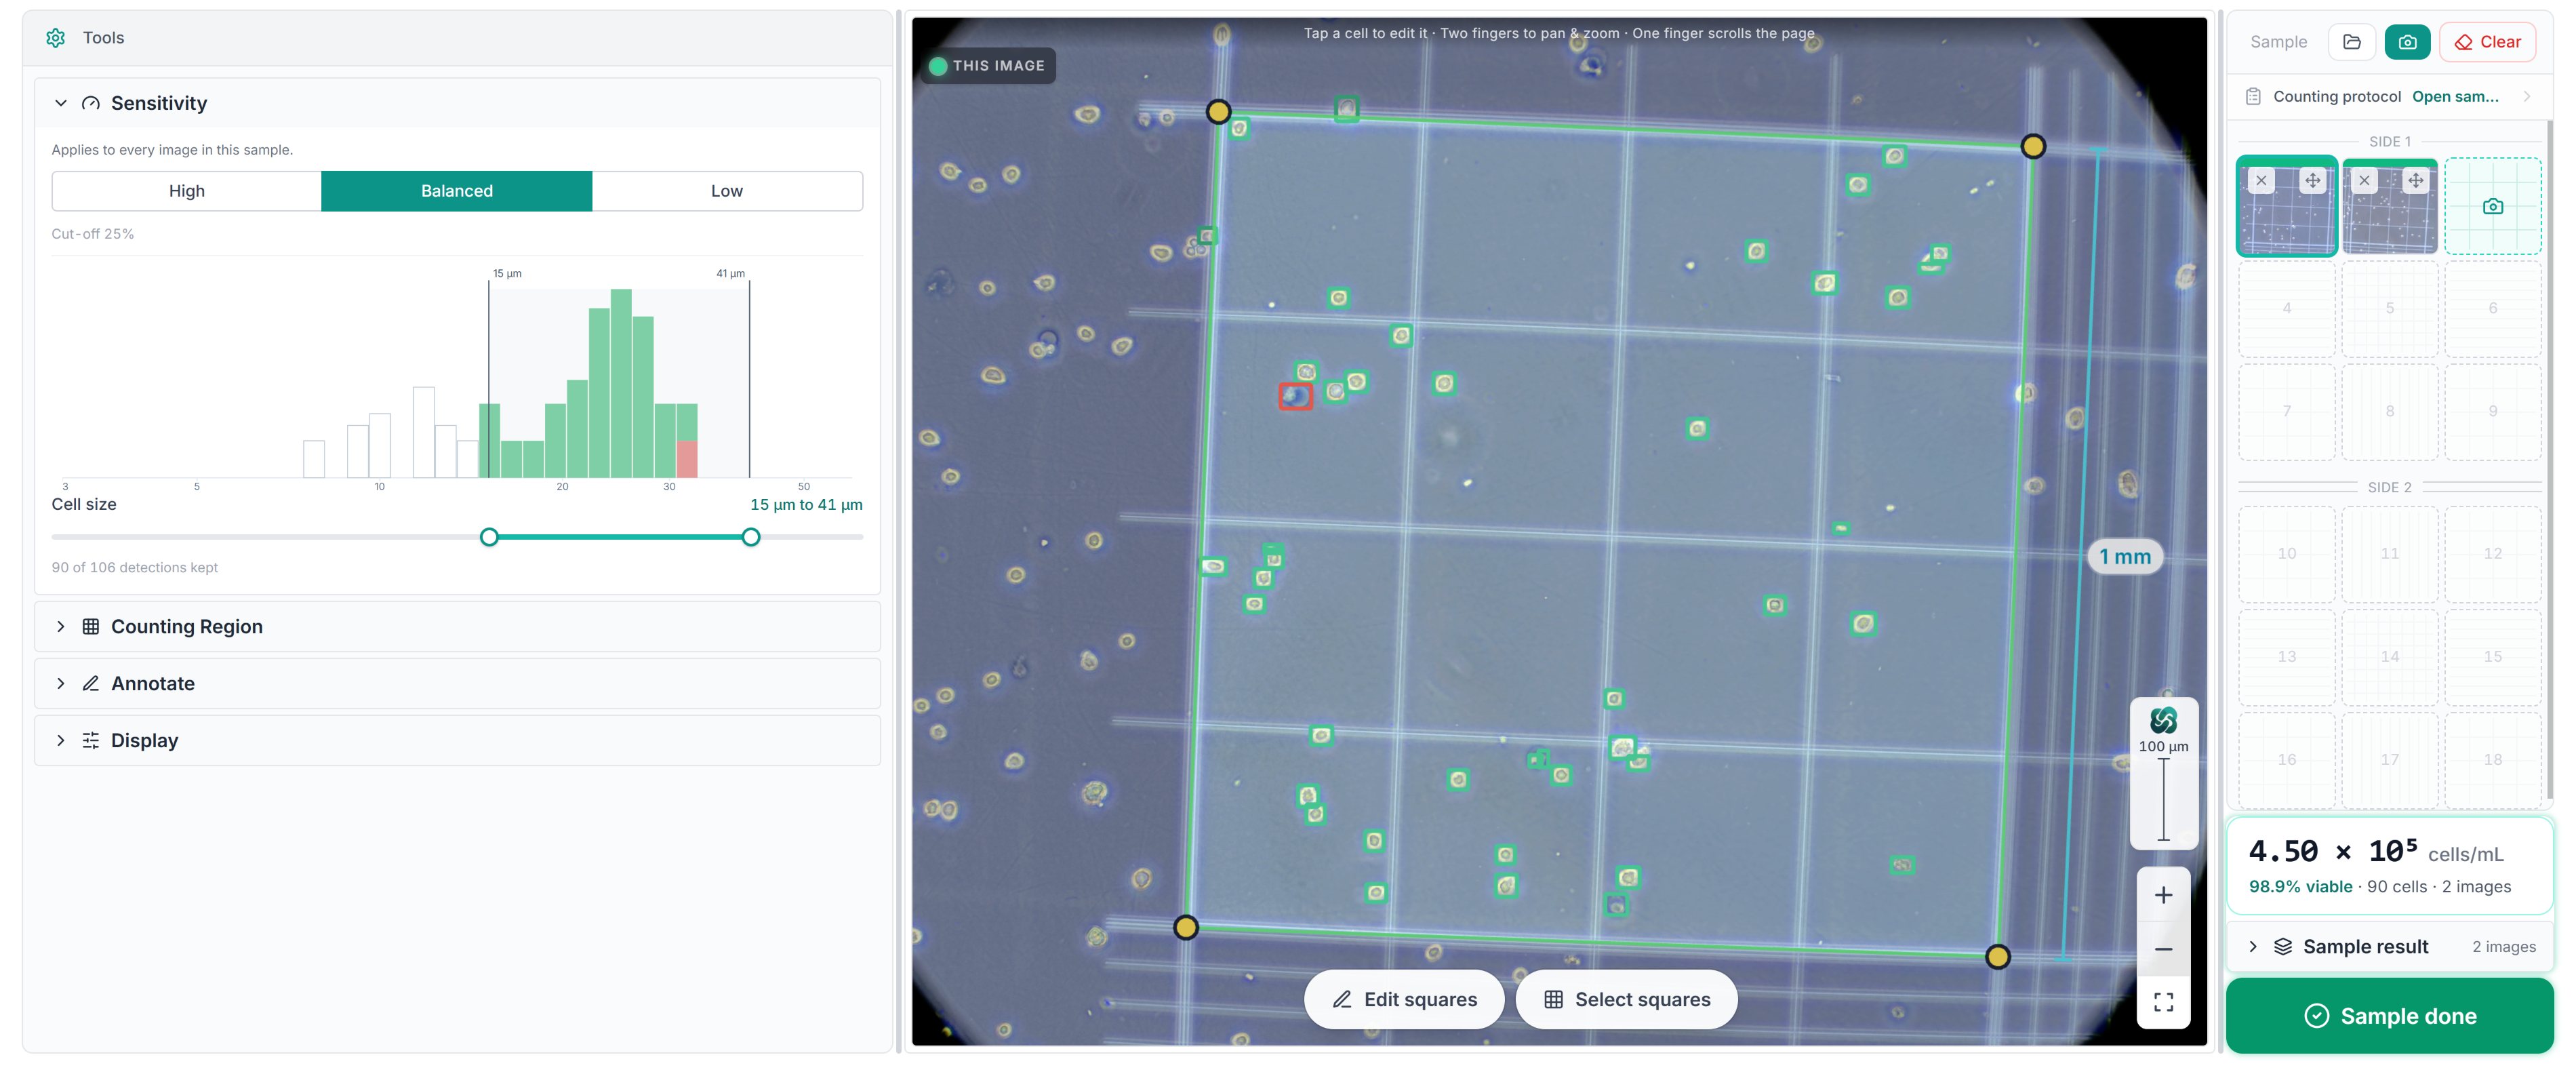
The counting surface: the sensitivity panel with the cell-size histogram and gate at 15 to 41 micrometres, the counted image with its measured grid and a corrected dead cell, the sample rail, and the two-image concentration result

Now count one yourself

The live demo puts a real sample on the counting grid and walks you square by square, just like this. No account, no camera, about a minute.

Protocol complete

Want it on your own samples? Book a call with a founder

Supported by:

Insj UiOStartupLabShareLabInnovasjon NorgeUniversity of Oslo